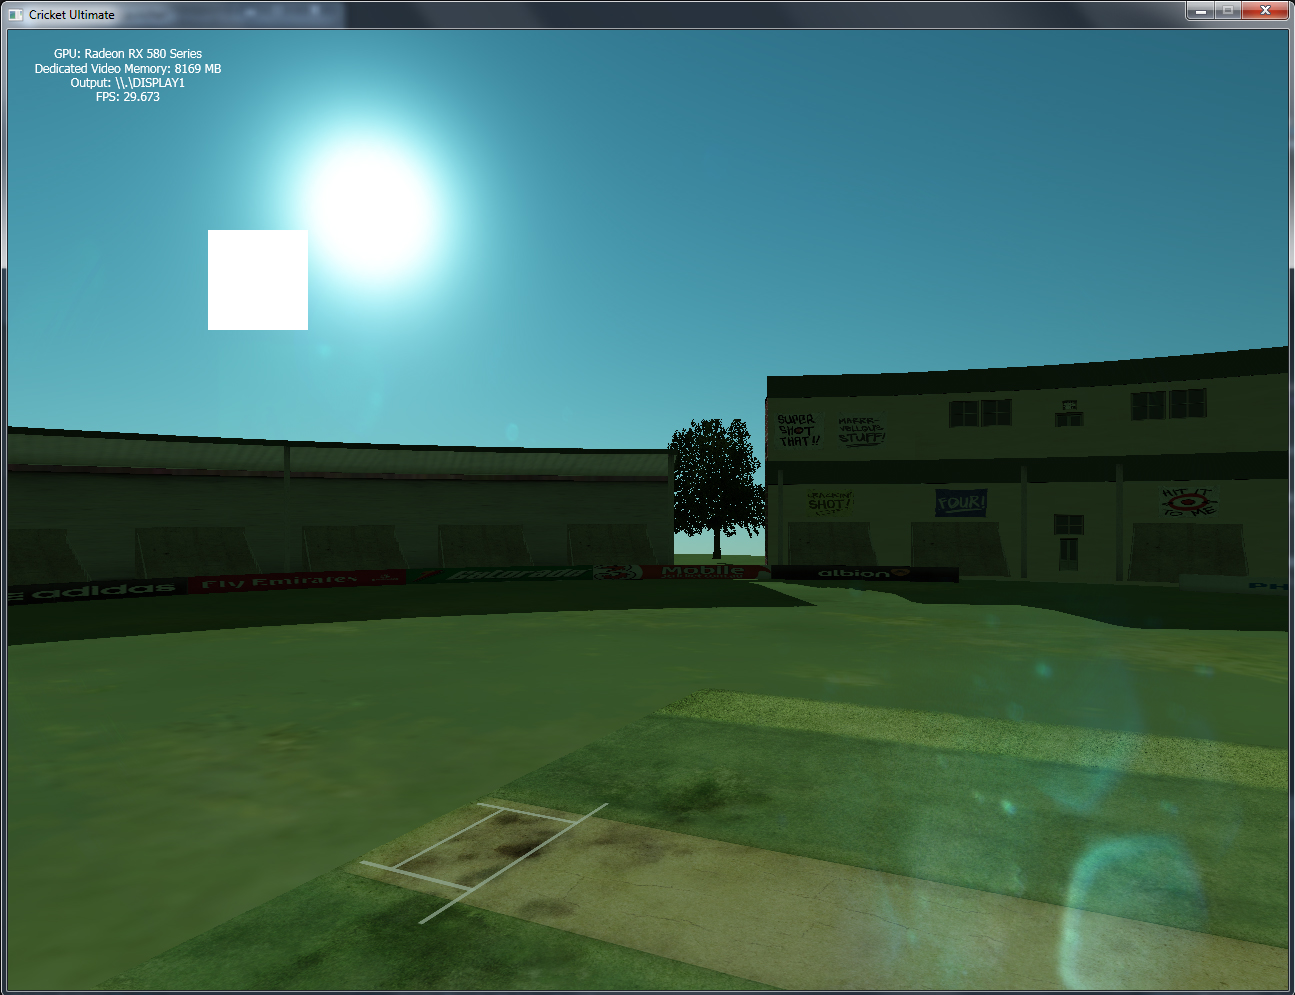
Hi, In my engine(forward renderer) there's no frustum culling mechanism. I render the entire 3d model(e.g. Stadium model) therefore performance is not good. On GTX 570 or RX580, this is the FPS I get. How can I improve performance?
Not many can claim 25 years on the Internet! Join us in celebrating this milestone. Learn more about our history, and thank you for being a part of our community!

Hi, In my engine(forward renderer) there's no frustum culling mechanism. I render the entire 3d model(e.g. Stadium model) therefore performance is not good. On GTX 570 or RX580, this is the FPS I get. How can I improve performance?
Looks pretty low poly, so i guess your low fps is a result of multiple other things. E.g. texture switches or other state changes, or GPU / CPU synchornization that happens within a frame but could be distributed over two (do you read any data back from GPU?). Or your SM resolution is very high, etc.
So, how many draw calls do you have? Is the stadium just one model using texture atlas, or is it many pieces using many textures? How many vertices / textures?
Are you sure geometry and texture is uploaded to video memory and not used from main memory?
For frustum culling, having a tree seems overkill for this scene. Probably just dividing the scene into smaller pieces manually (floor, one for each house, one for each tree) would be enough.
Then calculate bounding box for each and loop over all per frame to cull them.
However, this might increase the number of state changes and could even hurt performance. I guess the reason is something different.
JoeJ said:
Is the stadium just one model using texture atlas, or is it many pieces using many textures?
It consists of many pieces, 765 to be precise.
JoeJ said:
Are you sure geometry and texture is uploaded to video memory and not used from main memory?
yes, geometry and textures are uploaded to the video memory.
JoeJ said:
Or your SM resolution is very high
3 cascades consisting of 4096, 3072, 2048. I tried reducing the those and performance is the same.
But I isolated the problem. it's SM generation. W/o SM I get 100 FPS. For your convenience, I'll show you the CSM generation code.
		// part of the rendering function
		for (int i=0; i<3; i++)
		{
			RE_D3D11_ImmediateContext->RSSetViewports(1, &RE_D3D11_CSM_VP[i]);

			RE_D3D11_ImmediateContext->OMSetRenderTargets(0, &NULLRTV, RE_D3D11_CSM_DSV[i]);
			RE_D3D11_ImmediateContext->ClearDepthStencilView(RE_D3D11_CSM_DSV[i], D3D11_CLEAR_DEPTH, 1.0f, 0);

			mytest->CSM_GetLightViewProjection(i, mycam, RE_LightDirection, mLightViewProjection[i]);
			mytest->DrawCSM(RE_D3D11_ImmediateContext, RE_D3D11_SamplerState_Main, XMMatrixIdentity());

			RE_D3D11_ImmediateContext->OMSetRenderTargets(0, &NULLRTV, NULLDSV);

		}
void FBXUniLoader::DrawCSM(ID3D11DeviceContext *inImmediateContext, ID3D11SamplerState *inSamplerState, XMMATRIX &mWorld)
{
FbxTime fbxFrameTime;
if (mHasAnimation)
{
unsigned long long localAnimationTime = (GetTickCount64() % mAnimationLength);
fbxFrameTime.SetMilliSeconds(localAnimationTime);
BuildMatrices(fbxFrameTime);
}
inImmediateContext->IASetInputLayout(RE_Vertex_Layout);
RE_VSCB revscb;
for (UINT i = 0; i < mSkeleton.mJoints.size(); ++i)
revscb.Bones[i] = XMMatrixTranspose(mSkeleton.mJoints[i].BoneMatrix);
revscb.mHasAnimation=(int)mHasAnimation;
inImmediateContext->UpdateSubresource(RE_Vertex_Shader_ConstantBuffer, 0, NULL, &revscb, 0, 0);
inImmediateContext->VSSetShader(RE_Vertex_Shader, 0, 0);
inImmediateContext->VSSetConstantBuffers(0, 1, &RE_Vertex_Shader_ConstantBuffer);
RE_HSCB rehscb;
rehscb.TessellationFactor = 6.0f;
inImmediateContext->UpdateSubresource(RE_Hull_Shader_ConstantBuffer, 0, NULL, &rehscb, 0, 0);
inImmediateContext->HSSetConstantBuffers(0, 1, &RE_Hull_Shader_ConstantBuffer);
inImmediateContext->HSSetShader(RE_Hull_Shader, 0, 0);
RE_DSCB redscb;
redscb.mWorld = XMMatrixTranspose(mWorld);
redscb.mView = XMMatrixTranspose(mLightView);
redscb.mProjection = XMMatrixTranspose(mLightProjection);
redscb.mLVP0 = XMMatrixTranspose(XMMatrixIdentity());
redscb.mLVP1 = XMMatrixTranspose(XMMatrixIdentity());
redscb.mLVP2 = XMMatrixTranspose(XMMatrixIdentity());
inImmediateContext->UpdateSubresource(RE_Domain_Shader_ConstantBuffer, 0, NULL, &redscb, 0, 0);
inImmediateContext->DSSetConstantBuffers(0, 1, &RE_Domain_Shader_ConstantBuffer);
inImmediateContext->DSSetShader(RE_Domain_Shader, 0, 0);
inImmediateContext->PSSetShader(RE_Pixel_Shader_CSM, 0, 0);
for (int j = 0; j < ModelMeshes.size(); j++)// 765 for the stadium model
{
ModelMeshes[j].DrawMesh(inImmediateContext, inSamplerState);
}
inImmediateContext->VSSetShader(0, NULL, 0);
inImmediateContext->HSSetShader(0, NULL, 0);
inImmediateContext->DSSetShader(0, NULL, 0);
inImmediateContext->PSSetShader(0, NULL, 0);
}FBXUniLoader::DrawCSM
… what a nice way to hide some code in unexpected places : )
But I isolated the problem. it's SM generation. W/o SM I get 100 FPS. For your convenience, I'll show you the CSM generation code.
Hmmm, so from 30 fps to 100, by disabling to render the whole scene 3 times for cascades. So the speedup is expected if SM pass has same cost as camera render.
I see there's a lot going on in this function. It looks you transform / animate / upload the whole scene 4 times?
Probably you should do those things just once per frame, and some could move to level load?
I checked out the stadium model yes it consists of 765 pieces.
I built everything into FBX Unified Loader, animations(load if there's animation data), tessellations(can be switched off) etc. The only way I see is to do frustum culling. I already coded to extract Frustum planes from M=V*P. The only problem is how to attach BoundingBox to each and every 765 pieces.
I also tried GPU frustum culling in Hull shader. Still 3*765 DrawCalls are issued in DrawCSM. Thats why I cant gain any performance using GPU culling.
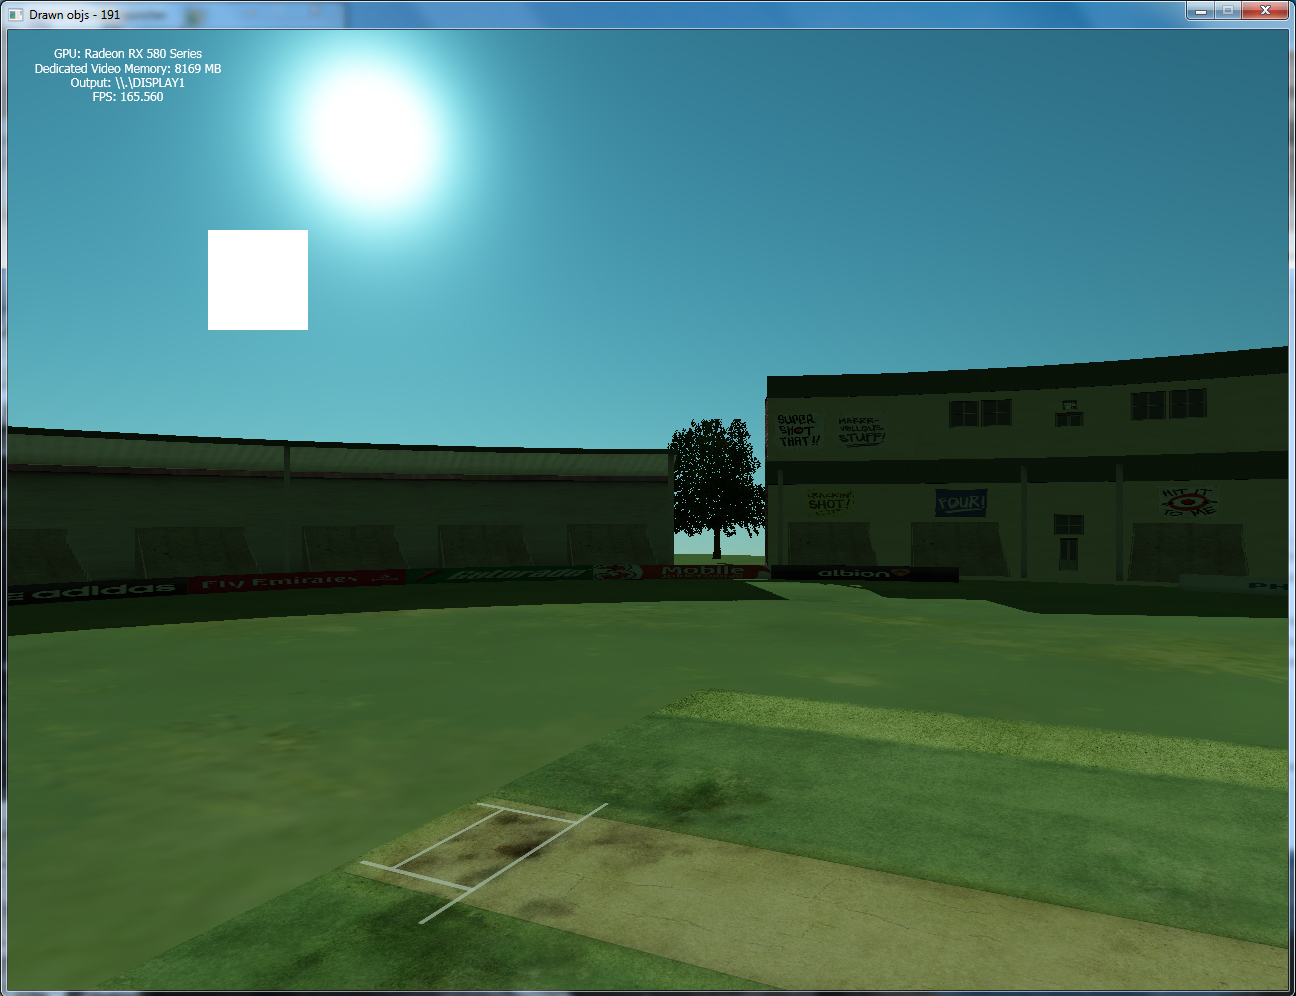
I implemented a frustum culling mechanism. Now w/o SM generation I get 250+ FPS.
With SM generation I get the following.
W/o culling:
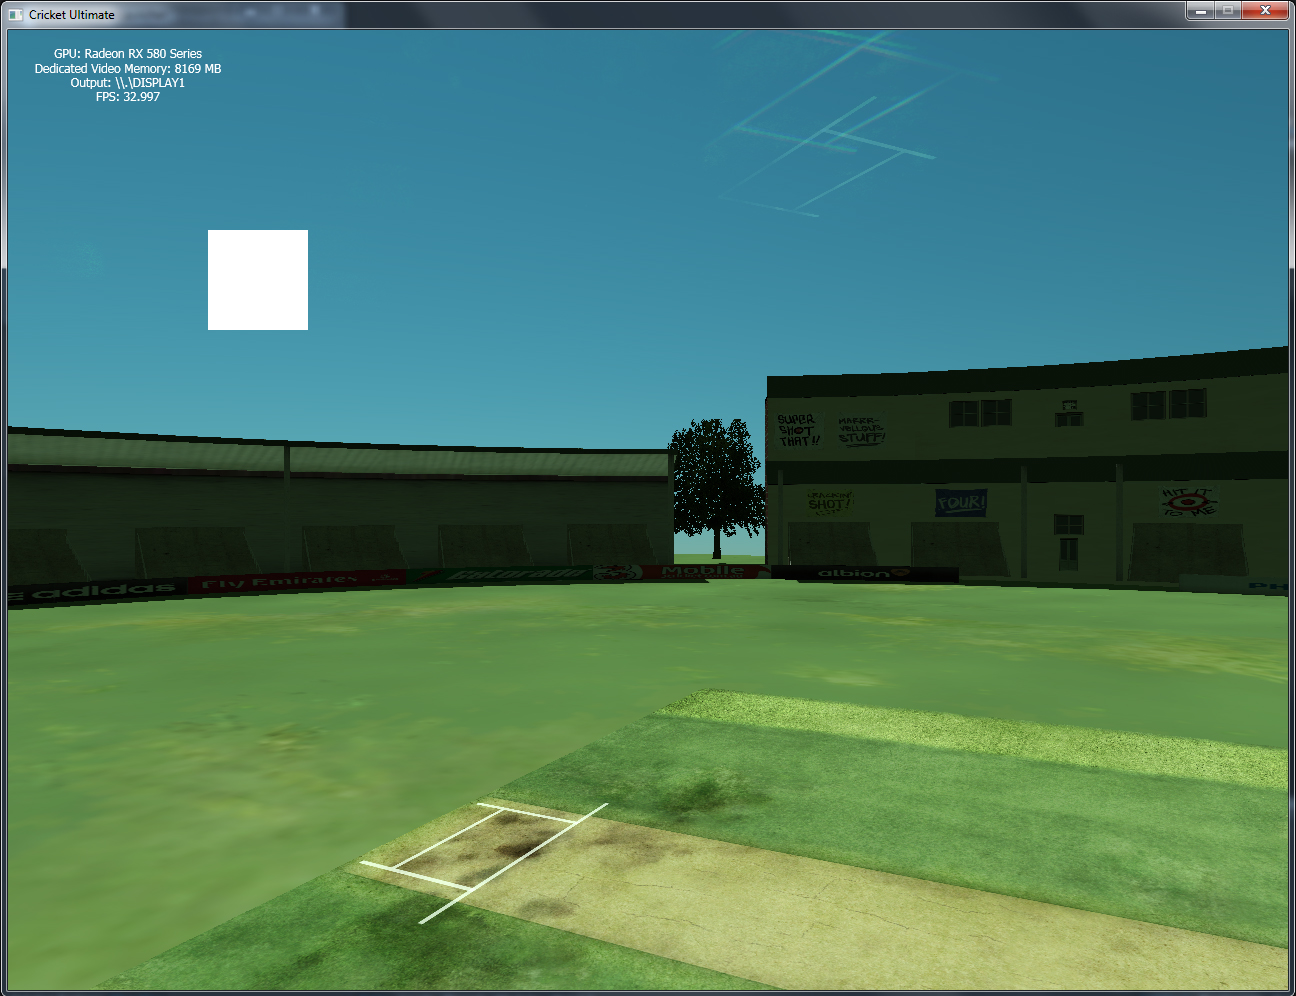
With culling:
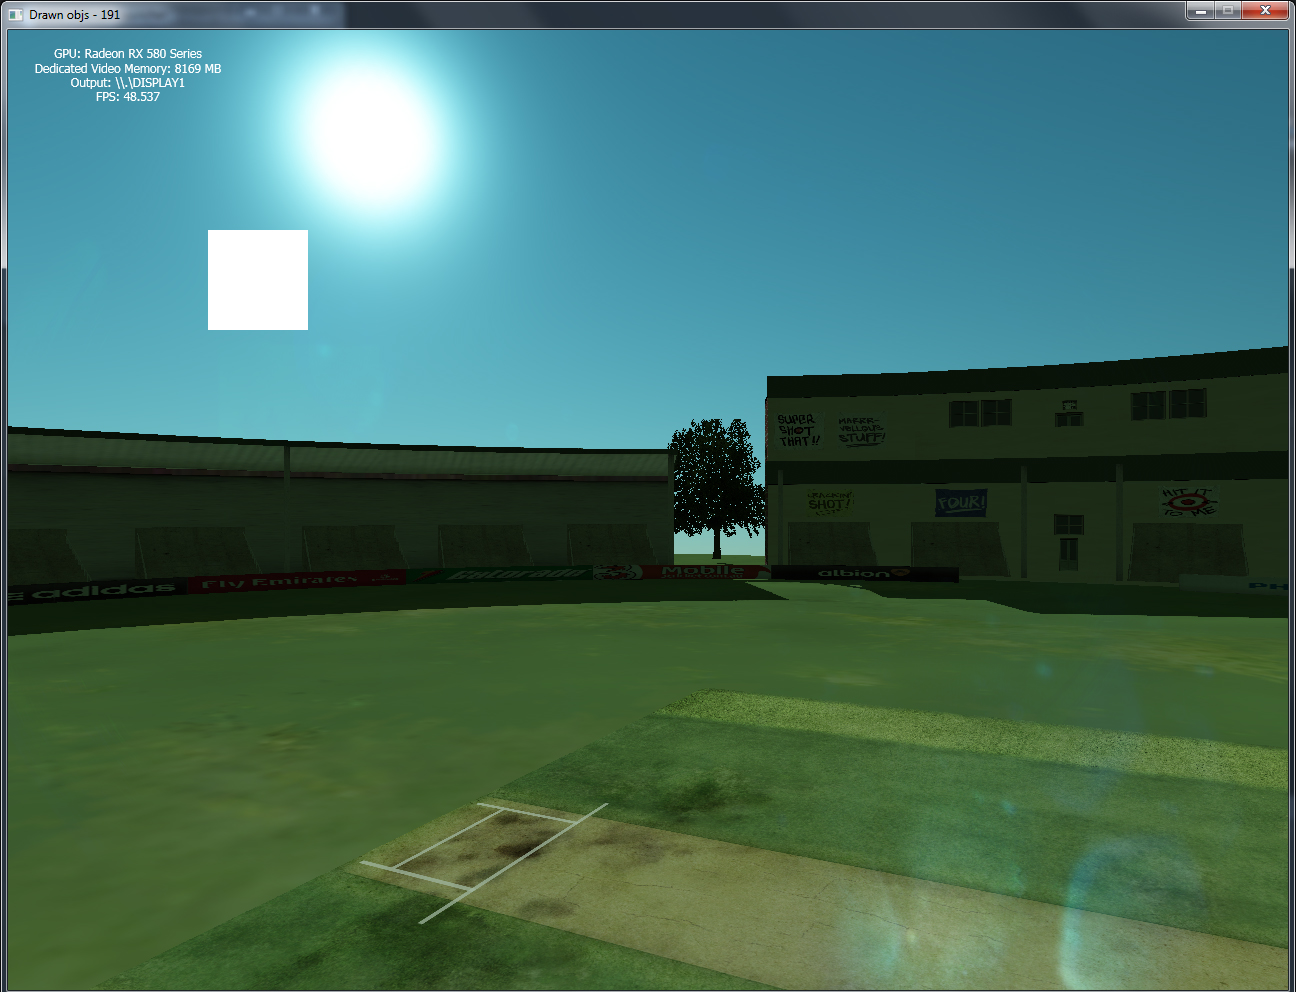
what profiling have u done?
by looking at your FPS 48.537, this shot is rendered in approximately 20.602839msec, so what is the timing breakdown like? only you can tell us…
you or your team (respectfully) are responsible for knowing how much time each part of your code is taking, what in your code is producing these 20+ msec per frame; you should profile your code to find out what part is taking too long, you might find that it could be an instruction that can be factored out of a loop… or….etc…;
i don't know if u know this, but worth running yr code in this or another: https://renderdoc.org/
also try and reuse data that doesn't change on a frame-by-frame basis, for example, u have loads of XMMatrixTranspose(XMMatrixIdentity()), why not have 1 of these and reuse it;
forgive me for saying this but, this shot looks like it should render in 4ms or less ?, so what's taking up the rest of your time? profile each code block and find out
also really for such a simple scene shot, try and bring all your drawcalls to 4 (skybox, shadow, scene, and ui). I'll let u figure out.
That's it… all the best ?
isu diss said:
I also tried GPU frustum culling in Hull shader. Still 3*765 DrawCalls are issued in DrawCSM.
To avoid the draw calls you can use indirect draws. A compute shader can then do the culling and generate indirect draw parameters to dispatch only visible stuff on GPU itself, and the CPU / driver has no work to do at all.
With DX12 / Vulkan, this whole culling and rendering system can be prerecorded into a command list, the command list gets uploaded to GPU only once, and then at runtime you issue only one single draw call to execute this command list per frame.
Just to mention this would be the ideal solution to limit draw calls. DX 11 does not have command lists and i'm not sure what's the options here, but looking at indirect draws surely makes sense…
I second the recommendation to use GPU profiling tools (Pix, RenderDoc, Nsight / Radeon GPU profiler, etc.). For me, not having them is almost like working blind folded. It's a bit of work to set them up and learn how to use them, though.
Additionally to those tools i also use timestamps exposed by gfx API (DX11 does so too i hope). Those timings are very precise and even taking hundrets of them per frame does not affect performance.
On CPU side i do the same (nowadays easy using std::chrono), and on modern PC timer resolution is good enough so you could look at all the animation / transform workloads in your function and see how many milliseconds they take.
It sounds you did not much profiling yet. It's really important to know where to spend optimization work seems most promising.
Thanks @joej and @ddlox for pointing out to use a profiler. The same code, some changes to culling mechanism was compiled this time for release. Then loading time of my program decreased significantly and performance increased to this. I will look into profiler none the less. But I'm happy ?
isu diss said:
he same code, some changes to culling mechanism was compiled this time for release.
Wait, so are you saying that your old code was compiled in debug mode, and this new 160-FPS is in release? That would just about make sense.